Analytics for Housing Managers
The course objective is to help managers to make the best possible use of data and evidence to enhance performance monitoring and decision making. Most data is presented in reports and we focus on understanding those reports (especially graphs and statistics). Additionally, and perhaps more importantly, the aim is to build curiosity so that managers develop a better appreciation of the content and know what it might be helpful and possible to explore further.
CONTENT
This course focuses on those who consume the analysis, developing their data literacy and curiosity.
The Analytics Landscape
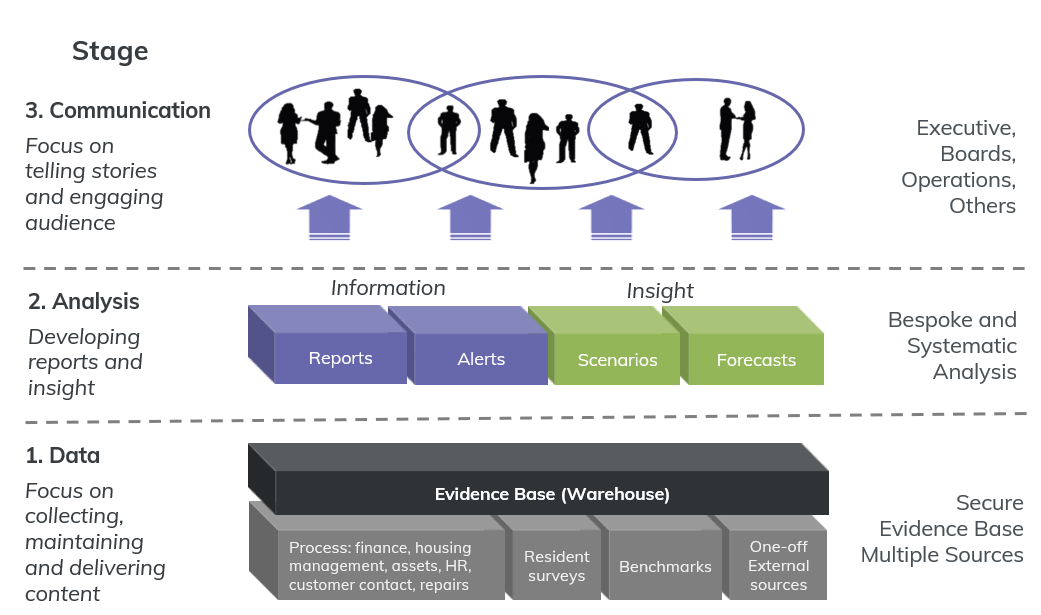
The diagram illustrates the three stages of good analytics:
gathering diverse data sources into an accessible and well managed space
running appropriate analysis (systematic regular reports and alerts as well as in-depth modelling and forecasting)
creating highly usable and interactive reports to multiple audiences
Within this framework, the course will focus on helping managers to make better use of the analysis by exploring:
key concepts and definitions
effective charts
statistical measures (averages and variability)
trends, seasonality and forecasting
TargEt Audience
The course is aimed at staff at the executive or operational management level and is designed as a half day course, with a high level of audience participation via group exercises and discussion.
PREREQUISITE
No technical skills are required, but a good understanding of Excel is always helpful. The only real prerequisite is a curious mind, willing to question and interrogate a report.
COST
Please contact us for exact course fees, but as a guideline, an on-site half day course for up to twelve delegates costs £950 plus VAT and expenses. This would use our example data. For an additional £950 we would use your data examples, for example the monthly arrears rate for the last 3 years and all repairs in the last 12 months.
Customer Comments
“Really valuable training, came away with a greater understanding of the importance of data and how to use it to demonstrate the work being carried out by my team.”
“Nothing to be improved - there was a lot of terminology and concepts to get your head around - the practical application was very good but a lot to take in as quite a new area for me! ”
“I think the pace and level of detail was very good and relevant for the audience in question. ”
“Training like this provides an opportunity for cross business exchange of ideas.
”

